Sampling design
The main types of statistical questions
As a scientist, you know that scientists ask an enormously wide range of questions about the world. As a statistician, you will see that most of these questions fall into a few basic categories. Once you recognize these categories and the types of statistical analyses each demands, your perspective on science will change, and you will grasp a broader array of scientific questions. What follows are four of the most common statistical questions, and you can use this as a guide to what statistical techniques to apply in any given situation.
How does the central tendency or typical value compare in two or more groups of data? The central tendency refers to the expected value of a variable. It is described by mean, median, and mode. Tests of the mean in two or more groups are typically done with a t-test or ANOVA, but similar tests can also be done for medians with their nonparametric equivalents, such as the Wilcoxon Rank Sum (Mann-Whitney U) and Kruskal-Wallis tests.
How does the amount of variation compare in two or more groups of data? Variation is described with range, sum of squares, standard deviation, and variance. Common tests include the F-test and ANOVA, although ANOVA is used more often to test for differences in means.
Are two variables correlated in a data set, that is, do they covary? As one variable increases in value, the other might increase or decrease. The strength of this relationship can be measured in several ways, including the parametric Pearson correlation coefficient and the nonparametric Spearman and Kendall rank correlation coefficients.
What functional (mathematical) relationship best describes how one variable changes with another? This is a question about regression, and there are many parametric and non-parametric techniques for this. Note that regression is a different question than asking about the strength of a relationship, which is called correlation. Multiple regression can be applied when you have a single dependent variable controlled by more than one independent variable.
Many of these four topics (central tendency, variation, correlation, regression) can also be answered with other classes of analyses, including resampling, likelihood, and Bayesian statistics.
Other questions arise in a large data set with many variables and samples. What is the primary structure of the data, that is what are the sources of variation in the data? This helps you to address various questions including: What variables covary with one another? Are there groups of covarying variables? Are some groups of samples more similar to one another than they are to those in other groups? How are samples distributed along gradients? Ordination techniques like the parametric Principal Components Analysis and the non-parametric Non-metric Multidimensional Scaling are a good place to start. Cluster analysis is another common technique for identifying groups of similar samples or variables that behave similarly.
Collectively, these represent many of the common questions and techniques of data analysis, and they will be the subject of the course. Knowing how to address these will lay the groundwork for other questions and analyses, including ones that this course won’t cover.
Your task as a data analyst is to identify the scientific question that is being asked, translate that into a statistical question, and apply the appropriate procedure. That is the goal of the course. We want to move beyond vague desires to “do some statistics” or “analyze” data because these usually result in poorly chosen statistical methods or a never-ending morass of pointless analyses. Likewise, we want to avoid doing statistical analyses just because we can or because that is what everyone else does; the scientific question should always drive the data analysis.
In short, data analysis starts by stating your scientific question clearly. With that, the statistical question can be phrased, which in turn makes the sampling design clear. Choose appropriate statistical techniques based on your question, and do only those.
Sampling design
For any statistical analysis, you must have replicates, that is, repeated measures of some quantity. The more replicates you have, the more reliable your results will be. How many replicates you need depends on what you are trying to detect: if you’re trying to detect a large effect or difference, a few replicates may suffice, but if you’re trying to detect a small effect, many more replicates will be required. Beware any blanket statistical wisdom you may have heard, such as, “You must have x points to do any statistics”, or worse, “You must have x observations for the work to be statistically significant”. Although statements like this are sometimes rooted in a particular type of analysis, they do not apply in every or even most situations. More often, these statements reflect a deep misunderstanding of statistics.
You will also need to randomize or intersperse your replicates so that the effect you are trying to detect is not inadvertently correlated with some other variable that systematically affects your samples.
For example, suppose you want to test the effect of a fertilizer on the growth of grass. Rather than apply the fertilizer to all of your experimental plots, you realize you will need to compare the plots that had fertilizer applied to the ones that did not. In other words, you need a control. You therefore plan two types of treatments: one in which the fertilizer is applied (black squares, shown below) and one in which it is not (the control, shown in white squares). Suppose you have eight trays of grass in your experiment, owing to limited funds, time, or space. You decide to apply the fertilizer to four of these trays, leaving four as controls, giving you an equal number of replicates for each treatment. So far, so good. You have several different choices for which trays will receive the fertilizer and which will not.
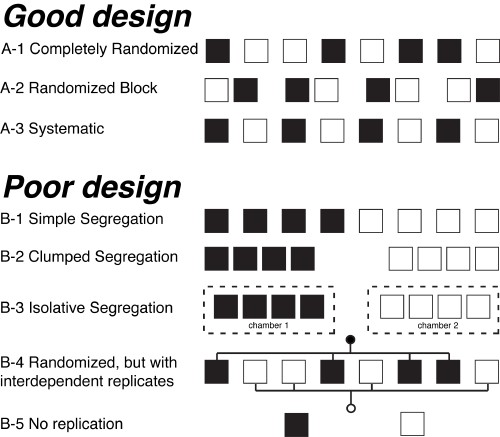
Image adapted from Hurlbert (1984).
Three of these strategies are good experimental designs. Choice A-1 is completely randomized, where each tray is assigned a random number that determines whether it will receive the fertilizer or be a control. It is a good choice, provided that the treatment and control plots are well interspersed; with few plots, assigning the plots with a random number generator might achieve interspersion. Interspersion is what is desired, more so than strict randomization. Choice A-2 is also good, in which the trays are placed in pairs, with one of each pair receiving the fertilizer and one being a control. Such randomized block designs are common and effective designs. Last, a systematic alternation of the trays (A-3) is also a good choice, provided no external influences are regularly spaced, such as having growing lights only above the control trays.
The remaining five strategies create a poorly designed experiment. The trays could be clumped with all of the fertilized treatments at one end and all of the controls at the other (B-1). If one end of the array is lit from a window, but the other end is not, the amount of sunlight will differ systematically for the two groups. Similarly, the trays could group all the fertilized treatments on one table and all the controls on another table (B-2). Even worse, the two groups might be separated and isolated from one another (B-3), with the fertilized trays in one greenhouse and the controls in a different one. The trays may appear to be interspersed (B-4), but some external factors might affect only one group, such as a watering system. Last, if the experimental design is to have only two trays, one manipulated and one control, the design has no replication (B-5), and it is the most basic type of poor experimental design.
Pseudoreplication
Pseudoreplication occurs when you collect multiple observations that are not independent of one another. Pseudoreplication is problematic because independence is a critical assumption underlying all statistical methods. In simple pseudoreplication, there is only one unit with the treatment and one as a control, but multiple measurements are taken from each. These replicate those units but not the experiment: a better design would be to have multiple treatment and control plots, with one sample from each. In temporal pseudoreplication, measurements are taken over time from each of the two plots but treated as replicates when they represent a time series instead. In this case, each observation from a plot is necessarily correlated with all other measurements from the same plot: the measurements are not independent. Pseudoreplication is a common problem, and you should watch for it. It affects not only experiments but also non-experimental data sets.
The five cases of poor design in the example above are examples of pseudoreplication, defined as when treatments are not replicated (although samples might be) or when replicates are not statistically independent. In cases B-1, B-2, and B-3, the replicates of the treatment are segregated from the controls. In case B-4, the replicates are interconnected, making them non-independent. In case B-5, repeated measurements (“replicates”) from the same experimental plot are clearly non-independent.
Although the figure was described in terms of the spatial positions of the samples, the same arguments apply if the figure describes the temporal ordering of the measurements.
Pseudoreplication is shockingly common. Of 537 ecological papers Hurlbert (1984) examined, only 191 described their sampling design and performed statistics — a depressingly low 36%. Of those that described their experimental design, 62 committed pseudoreplication; that’s 32%! The conclusions of every one of these papers are compromised by poor design.
The bottom line
Before collecting any data, you must design your work with replication and randomization. No statistical analysis can salvage a data set lacking sufficient replication or randomization.
Lecture slides
Download a pdf of the slides used in today’s lecture.
References
Hurlbert, S.H., 1984. Pseudoreplication and the design of ecological field experiments. Ecological Monographs 54(2):187–211.
