Best practices in statistics
Three approaches to hypothesis testing
We have covered three approaches to testing hypotheses: critical values, p-values, and confidence intervals. If you only want to decide on a hypothesis — to accept it or reject it — all three methods work equally well. For a critical value, a statistically significant result occurs when the observed statistic is more extreme than the critical value. For a p-value, a statistically significant result is when the p-value is smaller than a chosen significance level, often 0.05. A statistically significant result arises for a confidence interval when the null hypothesis lies outside of the confidence interval.
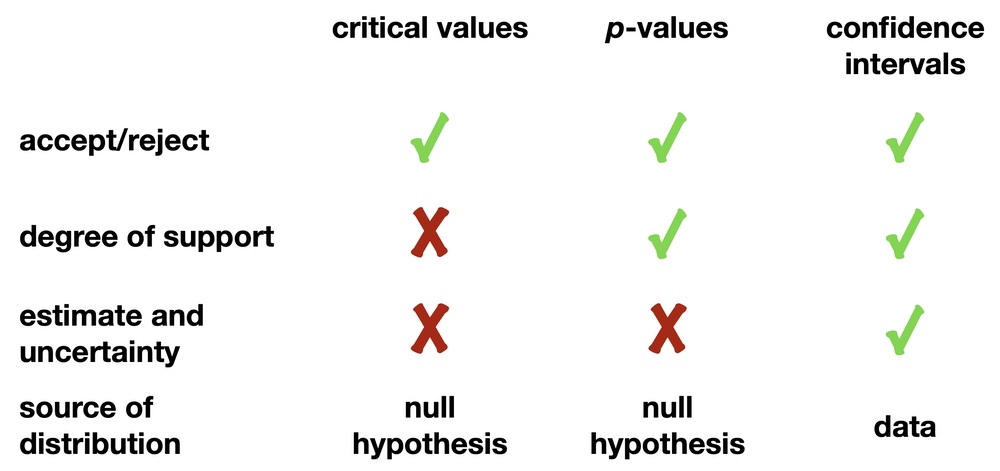
Only p-values and confidence intervals provide, in probabilistic terms, the degree of support by showing how rare a given result is. For this reason, both are preferred over critical values. You will likely use p-values and confidence intervals more often in your research and encounter them more often in your reading than critical values.
The drawback to the critical value and p-value approaches is that neither supplies an estimate of the quantity you are interested in (for example, a difference in means, or a correlation coefficient) or the uncertainty in that estimate. Confidence intervals do, and that is a strong reason for preferring them.
Of the three approaches, p-values are by far the most widely used. Even so, their use in data analysis is increasingly criticized. Moreover, statistical hypothesis testing, which results in a simple accept or reject decision, is also coming under fire. These criticisms are well-founded, and this course will follow a best-practices approach to data analysis: we will emphasize estimation and uncertainty, that is, confidence intervals.
It is important to remember that the distributions upon which these three approaches are based differ. Critical values and p-values are based on the distribution of outcomes generated by the null hypothesis. In contrast, confidence intervals are derived from the data (sometimes with an appropriate theoretical distribution), making them useful when one wants to test multiple hypotheses or when there is no clear null hypothesis.
Problems with p-values
Two common misconceptions surround p-values, and you are certain to encounter them. They are common in scientific literature and at conferences.
The first misconception is that p-values are the probability that the null hypothesis is correct. This is not true. Recall the definition of a p-value: when the null hypothesis is true, a p-value is then the probability of observing a statistic or one more extreme. We could simplify this statement to the form of “if X, then Y”. The misconception about p-values flips this argument to “if Y, then X”, a logical error called affirming the consequent. A simple example shows you why you cannot reverse the definition of a p-value.
Suppose you study frogs and find that 80% are green. You could then say, “If it’s a frog, there’s an 80% chance it is green”. By following the misconception of p-values, we might try to flip this statement so that it becomes “If it is green, there’s an 80% chance that it is a frog”. This is obviously not true because if you find something green, it probably isn’t a frog: it’s probably a plant!
The second misconception arises because scientists commonly but incorrectly use p-values to indicate how important a result is. It is common and correct to say that a p-value less than α (often 0.05) is statistically significant, and values greater than α are not statistically significant. Often the misconception comes from dropping the word “statistically”, by describing a result as “significant”. “Significant” is a loaded word in that it has two meanings. The first is in the statistical sense, meaning that the probability of an outcome is so low that you could reject the null hypothesis. The second is the more plain-English sense, meaning important or substantial. Just because something is statistically significant does not mean that the result is important or substantial, because significance may have been achieved through a large sample size rather than a large effect size.
Another variation on this problem comes by adding adjectives before “significant” that imply importance. For example, someone might say a tiny p-value is highly significant, a p-value slightly smaller than 0.05 is marginally significant, and one greater than 0.05 is insignificant. Again, the confusion comes about by the two distinct meanings of “significant”: by saying “highly significant”, many people might conclude incorrectly that the result is highly important, that the effect size is large. By describing a result as insignificant, many people would conclude that it means unimportant.
A similar problem arises when attaching asterisks to p-values, with more asterisks for increasingly smaller p-values. Even R has this built into most results, as we will see when we get to ANOVA, regression, and other linear modeling techniques.
Because of this misconception that p-values convey importance, scientists sometimes only present tables of p-values as the sole results of their statistical analyses. Never do this. This should be avoided because what we are usually most interested in is estimates of parameters and their uncertainties, not the probability that the data would arise if the null hypothesis were true.
Because p-values are controlled not only by effect size but also by the amount of variation and, importantly, sample size, p-values cannot be read as describing the importance of a result. For example, a large sample size may be all that is needed to detect a minor pattern and achieve statistical significance through a low p-value, even one that is quite small. As the size of your sample increases, you will be able to detect ever smaller, ever less important phenomena. Do not use ’significant“ and ’insignificant“ to describe the results of a statistical test. Doing so confuses most readers about whether the effect size is substantial.
For this example, whether the sample means are different is not the question we should focus on. The important questions are how different the means are and what our uncertainty is in that difference. If we had sufficient data and performed our statistical test, we would find that the difference is statistically significant, perhaps highly so (a tiny p-value). With a very large sample, however, we could detect even a minuscule difference in means, a difference so small that although it would be statistically significant, it may not be scientifically important. For example, the mean heights of two forests might differ by 1 mm, a difference that is surely of no meaningful consequence if the trees are 50 m tall. Similarly, we might find in a large enough study that the effectiveness of a drug is statistically significant when it raises survival by merely 0.01%, an effect so small to be of little use.
Problems with significance testing
More broadly, there are several reasons to be concerned with the entire concept of statistical hypothesis testing, of using statistics to reach a simple dichotomous accept-or-reject decision. These criticisms apply not only to p-values but also to critical values and even to confidence limits when the only goal is to accept or reject a null hypothesis. Let’s consider three of the largest problems with significance testing.
1) Many significance tests serve no purpose, particularly two-tailed tests, because they are solely focused on finding a difference from the null hypothesis. For example, one common approach is to test whether the means of two groups are different, specifically whether the difference in their means is zero. In most cases, we know the answer to this question before we collect any data at all: we can state with complete certainty that the means are different. How do we know this? Take two populations of anything in nature, measure some quantity on them, and calculate the means. Those two means are almost assuredly different; the difference might be in the sixth decimal place, but those means differ. No statistical test is needed: we know that the null hypothesis is false before we even start. This is a crucial aspect of two-tailed tests in that it is the one case where you generally know if the null is true or false; in two-tailed tests you know that the null is false (e.g., the means or variances are not exactly identical, the correlation or slope is not exactly zero, and so on)..
2) Significance tests ask the wrong question. Let’s continue with our example of comparing two sample means. We know that they are different, and therefore, that the null hypothesis is false. If we perform a statistical test, it will lead us to either reject or accept the null hypothesis. Because the null hypothesis is false, rejecting it is the correct decision, and this will happen if our sample size is large enough. If our sample size is not large enough, we will not be able to reject the null hypothesis, and accepting a false null hypothesis would be a type 2 error.
In other words, when the null hypothesis is false, a statistically significant result (rejecting the null) tells us only that we collected enough data to detect the difference, and a statistically non-significant result (accepting the null) indicates that we have not collected enough data. This is not helpful: our test has not revealed anything about the two samples, and all we learn is whether we have collected enough data to detect their difference. Rather than asking if the means are different, we should instead ask what the difference in means is and what our uncertainty is in that difference. Similarly, we should not ask whether a null hypothesis can be rejected, but which of several hypotheses is best supported by the data.
3) Statistically non-significant results of tests are commonly misinterpreted. When scientists generate a p-value greater than 0.05, they conclude that the result is not statistically significant, which is correct. If they are comparing the difference in two means, they may further describe their results as saying that there is no difference in the two means, which is not correct. This is not what the statistical test allows you to say because it tested only one very narrow possibility: zero difference in the means. If one were to test other hypotheses in which the means differed by some value, they may also produce large p-values, meaning that those hypotheses would be acceptable, just as the null hypothesis is. This problem exists for all statistical tests, not just comparisons of sample means. For example, in correlation tests, a p-value greater than 0.05 does not indicate a lack of a correlation, only that no correlation is one of several acceptable alternatives. All of this arises from misunderstanding what is implied by accepting a null hypothesis. Accepting the null hypothesis does not mean that it is correct or true; it means only that the null hypothesis is one of potentially many acceptable null hypotheses.
Although these examples were demonstrated with p-values, these criticisms also apply to critical values and confidence intervals when we use them to reach a dichotomous accept-or-reject decision on a null hypothesis.
A path forward
Given the criticisms of p-values and those of significance testing more broadly, one might wonder what a scientist should do.
These criticisms do not mean that p-values have no place or should be banned, although some statisticians have argued this, and some journals have banned them. These criticisms also do not mean that we should stop using statistics altogether. What they do mean is that we have to stop using them in a dichotomous way (i.e., accept/reject) and that we have to report our results fairly and without the misuses that conflate statistical and scientific significance.
Instead of focusing on p-values, we should place a greater emphasis on estimating parameters (e.g., mean, variance, correlation, slope, etc.) and the uncertainty of those estimates. For example, when we compare sample means, we should not focus on the narrow and almost certainly false hypothesis of zero difference. Instead, we should estimate the difference in sample means and the uncertainty in that difference. Doing this reveals the range of explanations compatible with our data, far beyond a single null hypothesis.
Even with a confidence interval, it is important to realize what it represents. Although a confidence interval is a set of hypotheses consistent with the data for a given level of confidence (often 95%), hypotheses towards the center of that interval (that is, closer to the estimate) are more likely to result in our data than hypotheses near the edges of the confidence interval. Moreover, hypotheses just beyond the confidence interval could still generate our data, although that becomes improbable. For example, values just outside a 95% confidence interval might well fall inside a 99% confidence interval.
For now, and likely for some time into the future, we will have to live with p-values. Advisors, editors, and reviewers may demand them, particularly when they do not understand these issues. You should try to raise awareness, but realize that you may be forced to use p-values. If so, be clear about what a p-value represents: the probability of observing a statistic or one more extreme if the null hypothesis is true, not vice versa. Report p-values with reasonable precision (one or two significant figures, at most), and don’t report them with inequalities (e.g., p<0.05). Don’t tag p-values as significant or insignificant based on arbitrary criteria such as 0.05, and don’t flag p-values with stars to imply that some are more special than others. Even if you must use p-values, focus on the values of your estimates (and their uncertainty) to understand the scientific significance of your results and the hypotheses consistent with the data.
Reading
Scientists rise up against statistical significance
References
Amrhein, V., S. Greenland, B. McShane. 2019. Scientists rise up against statistical significance. Nature 567:305–307.
Brookshire, B. 2019. Statistician want to abandon science’s standard measure of ’significance‘. Science News.
Holland, S.M. 2019. Estimation, not significance. Paleobiology 45:1–6.
