Digitizing points
12 December 2024
Sometimes we need to extract the data from a published plot, and here I present an R function called clickGraph() that makes this simple. This function will load a scanned graph into an R plot, and then you simply click on each data point and press the escape key when you are finished. The function will return a data frame of all the data points scaled to their values in the plot.
Here’s how you use clickGraph():
First, download the clickGraph.R source file and put it in R’s working directory. Download the png and jpg libraries in R if you do not have them already.
Load the clickGraph function by typing the following in R:
source("clickGraph.R")
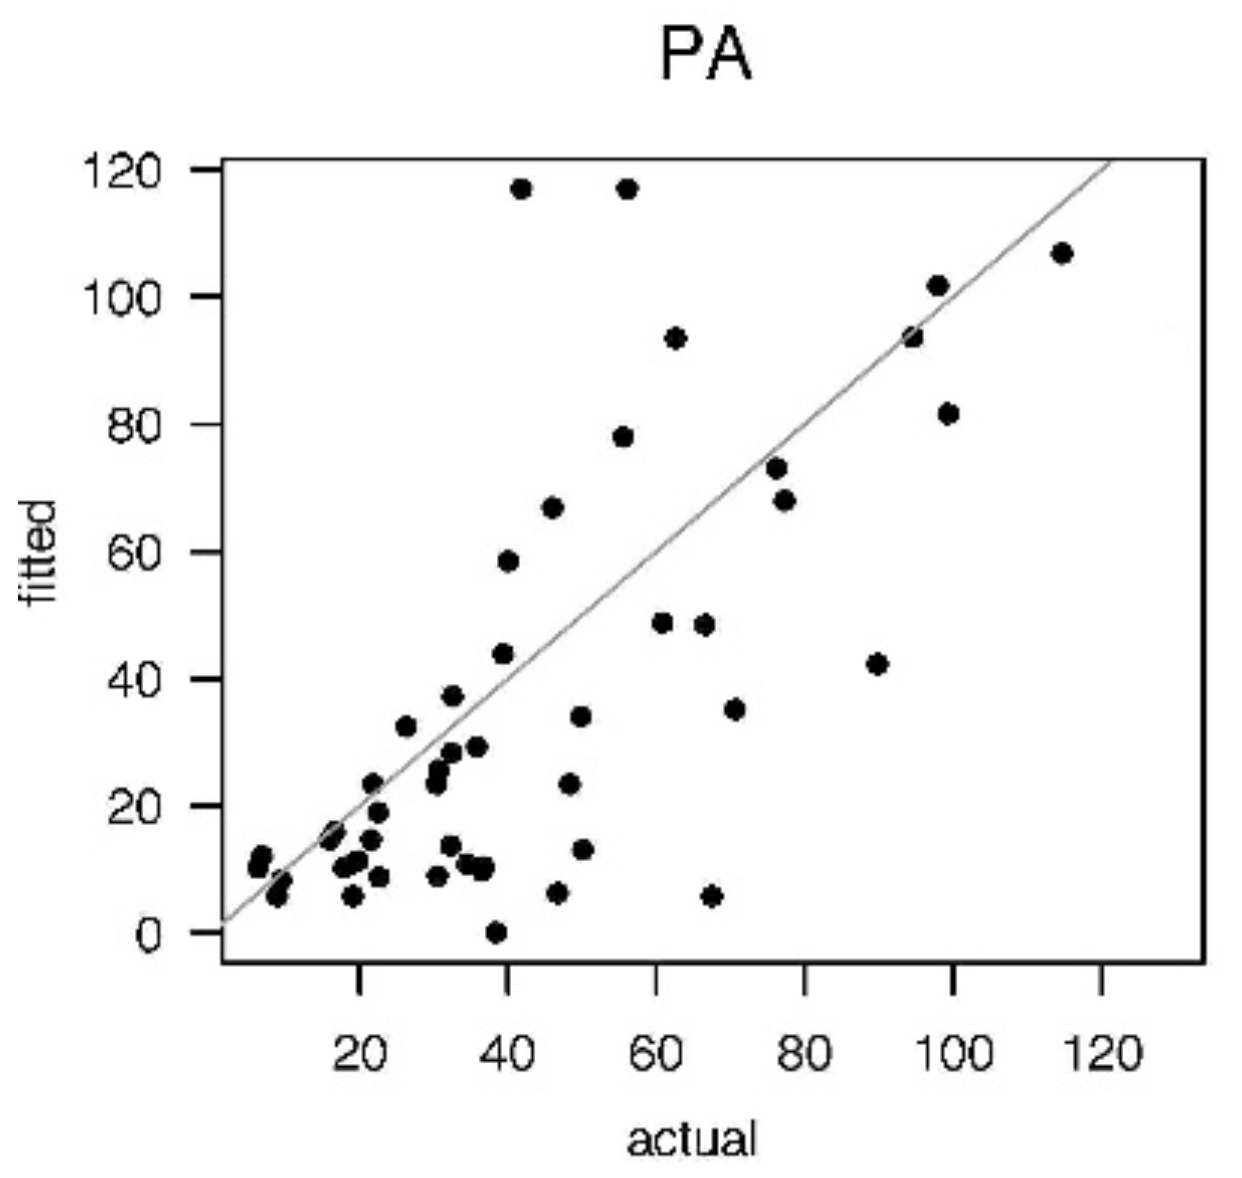
Open the image in an image editor like Photoshop or a similar program that will let you crop the image. The image below is from Figure 7 of Holland and Zaffos (2011; Paleobiology 37:270–286). Examine the graph and write down the smallest and largest values on the x and y axis. On this plot, the limits of x are 0 and 120, as are the limits of y.

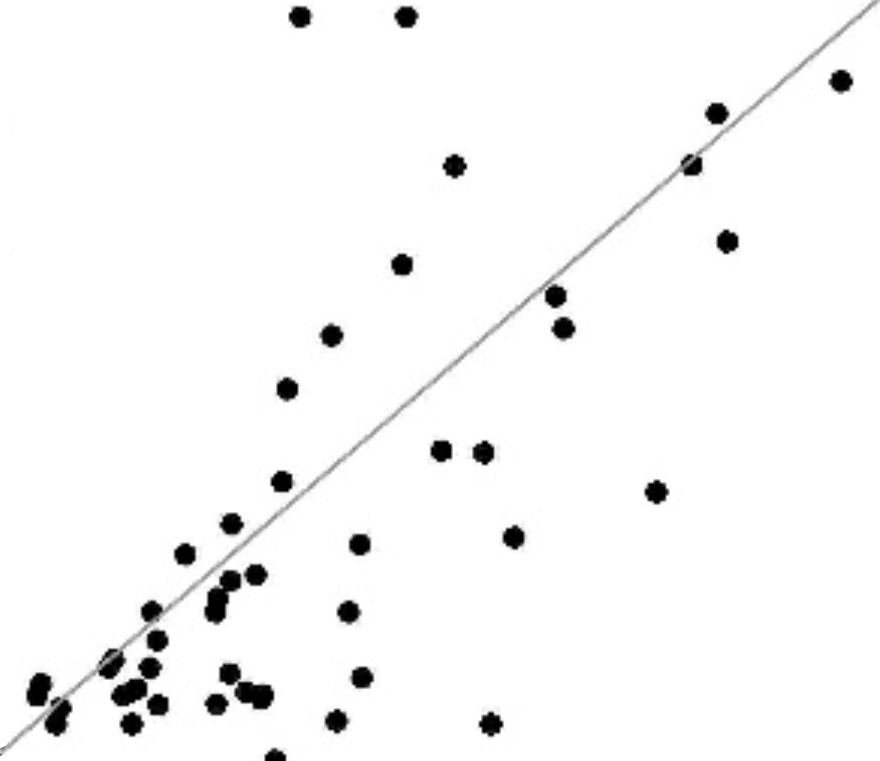
Crop the image in your image editor so that the edges correspond exactly to the limits you just wrote down, and save the file as a .jpg, .jpeg, or .png file. The example image now looks like this after cropping:

Next, digitize the image in R by invoking the command:
graphData <- clickGraph("graph.jpg", xright=120, ytop=120, xvar="actual", yvar="fitted")
The clickGraph() function has seven arguments. The first is the name of the graph file. The next four (xleft, xright, ybottom, and ytop) specify the edges of the graph. xleft and ybottom have default values of zero, so we do not need to set them here. The last two arguments (xvar and yvar) are what you will want the x and y values to be named in the data frame; if you do not specify these, the variables will just be called x and y.
When you run the clickGraph() function, a plot will appear and your cursor will turn to a crosshairs. Small red dots will be in the fours corners, marking the x and y limits you specified. It will help to expand the plot as large as possible to minimize digitization errors. Start clicking on data points; small red circles will tell you which points you have digitized. When you are done, press the esc (escape) key. Your data will now be in the data frame, graphData in this example.
