Plotting Rose Diagrams
24 March 2016
When we collect directional data, such as paleocurrent or wind directions, we need a way to show their frequency distribution. A standard histogram does a poor job of this, partly because it doesn’t show directions as on compass. More important, it fails to convey that the scale wraps around: 10° and 350° are numerically very different than 10° and 30°, but their angular differences are identical.
Rose diagrams solve both of these problems by displaying the frequency distribution radially. The circular package makes constructing rose diagrams simple.
Loading the circular package warns you that the default functions sd and var are masked, being replace with those from the package. If you later want to use the default versions of sd and var, you can detach the circular package by calling detach("package:circular").
library(circular)
Building the rose diagram is a two-step process. First, the data must be converted to a circular object, which means specifying that the data are directions, in degrees, are geographically referenced, and that the values increase clockwise. Second, the rose diagram is constructed, which may include setting the number of bins, setting the color, turning off the border, etc.
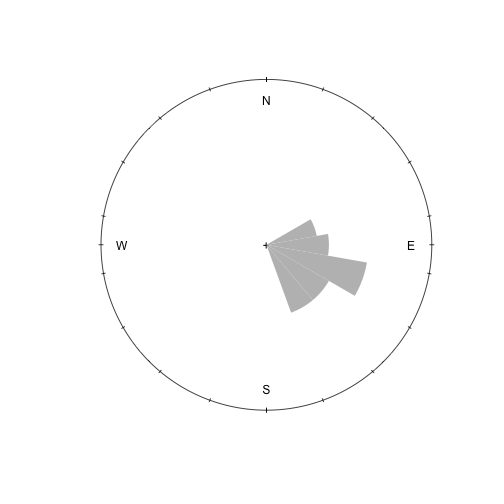
x <- c(103, 151, 148, 119, 134, 101, 152, 119, 130, 87, 99, 116, 92, 71, 142, 106, 135, 138, 65, 115, 107)
x.circ <- circular(x, type="directions", units="degrees", template="geographics", rotation="clock")
rose.diag(x.circ, bins=18, col="gray", border=NA)
There are other ways to plot rose diagrams, like compassRose in the sp package. The ones I have tried are less desirable because they follow unit circle coordinates rather than compass coordinates, which differ in two important ways. Values on a unit circle increase counterclockwise whereas those on a compass increase clockwise. Furthermore, the origin of a unit circle is on the right side (east), compared with a compass, where the origin is at the top (north). As anybody who has wrestled with converting these two coordinate systems can tell you, it would have been lovely if the geographers and geometers had agreed on a single coordinate system.
Comments
Comments or questions? Contact me at stratum@uga.edu
