Plots with semi-transparent symbols
1 December 2009; updated 7 March 2019
When plots have many densely spaced points, it can be difficult to determine how many points are present where points overlap. To solve this problem, you can make data points semi-transparent by specifying their color with the rgb() function, which takes four arguments. The first three are the values for red, green, and blue; by default, each varies from 0.0 (none of that color) to 1.0 (the maximum). The fourth argument is for the alpha value, which sets the opacity; by default, it also varies from 0.0 (transparent) to 1.0 (opaque). Here's an example of how to use rgb():
> x <- rnorm(5000) > y <- rnorm(5000) > plot(x,y, pch=16, col=rgb(red=0.2, green=0.2, blue=1.0, alpha=0.2))
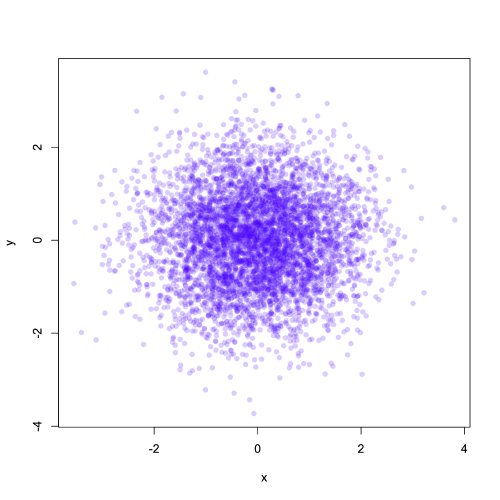
If you have many points with a large amount of overlap, it is best to set alpha to a small value. If you have fewer points or less overlap of points, a larger value of alpha will work. Experiment to find the best value.
The rgb() function can be called wherever you need to specify a color. If you’re trying to match a certain color, you may want to first use the color pickers that are built into macOS or Windows. For example, the color picker for macOS, lets you find the red, green, and blue values for a desired color.
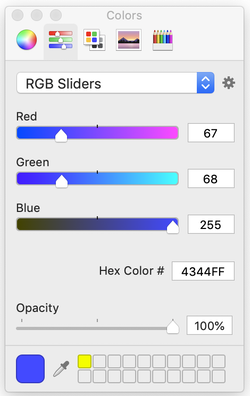
Color pickers like this often specify the red, green, and blue values on a 0–255 scale. To use this scale in the rgb() function, add the parameter maxColorValue=255. Note that this will also require you to specify alpha on the 0–255 scale. For example, this will make the same plot as above, with red, green, blue, and alpha on the 0–255 scale, instead of the default 0–1 scale.
> plot(x,y, pch=16, col=rgb(red=51, green=51, blue=255, alpha=120, maxColorValue=255))
