MEASURING THE SOLAR ECLIPSE
08/22/2017
Yesterday’s total solar eclipse was spectacular, especially along the line of maximum totality near Clemson, South Carolina, where we watched it. I used my Arduino temperature and light logger to record the progression of the eclipse.
Here’s the plot of data, made in R (code is below).
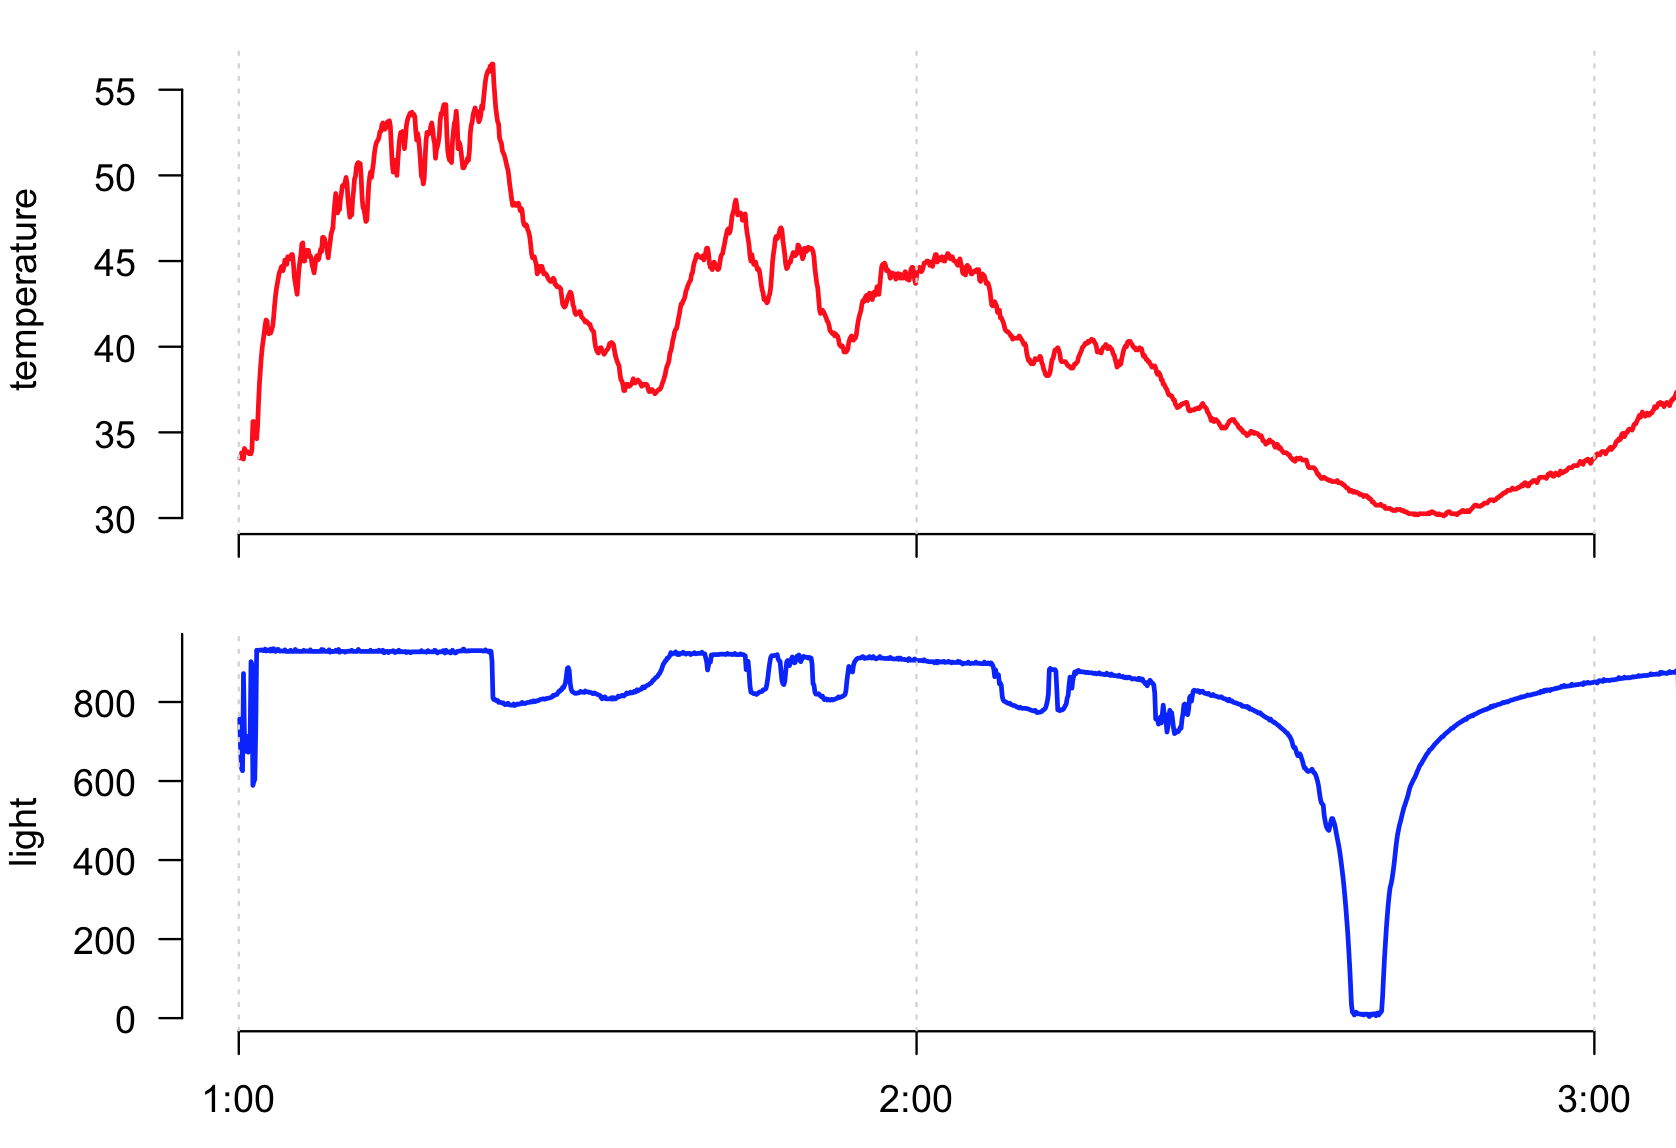
The light measurements show nicely the total darkness at about 2:40 PM, and how quickly the light dropped off and picked back up in the ten minutes before and after totality. The small dips between 1:20 and 2:10 were the shadows caused by passing cumulus clouds, and the small dips in the first five minutes were my shadow as I got the device set up.
The temperature data is more problematic. It does show a nice symmetrical dip around the eclipse, with a slight lag in the coolest temperatures after the peak in the eclipse. Even the dips in light caused by clouds have a corresponding drop in temperature.
The problem with the temperature data is the scale, with temperatures up to 56.5°C (134°F). According to the National Weather Service, temperatures around 1–2:00 in Clemson peaked at 33.3°C (92°F). My higher temperatures were caused by the temperature probe (a black transistor) being exposed to the sun on the same board as the light sensor. These temperatures are artificially high because the temperature probe was being heated by the sunlight on its black plastic surface. I don’t know of any way, after the fact, to separate the atmospheric contribution to this temperature data from the surface-heating contribution. All I can do is remember this problem for the next eclipse and be sure the temperature probe is in the shade.
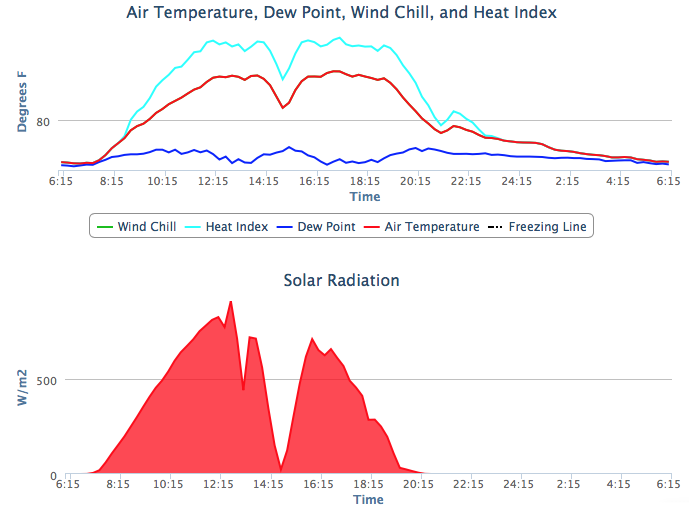
Data from the Horticulture Research Farm in Watkinsville, Georgia (shown above), which experienced approximately 99% totality shows a good connection between the dip in sunlight with the eclipse and a drop in air temperature. Temperatures immediately before and after the peak of the eclipse (on the shoulders of that pronounced dip in temperature) were about 31.6° (89°F), with a minimum temperature during the eclipse of 28.1°C (82.6°F). That suggests that much of my temperature drop owes to surface heating, not air temperature.
R code for the plot
ard <- read.table(’tEMPER.TXT", header=TRUE, sep=",')
attach(ard)
par(mfrow=c(2,1))
par(mar=c(1, 4, 1, 2) + 0.1)
plot(temperature, type="l", lwd=2, col="red", axes=FALSE, xlab="")
axis(1, at=12*60*0:2, labels=FALSE)
axis(2, at=seq(30, 55, 5), labels=c("30","35","40","45","50","55"), las=1)
abline(v=12*60*0:12, col="lightgray", lty=3)
par(mar=c(3, 4, 1, 2) + 0.1)
plot(light, type="l", lwd=2, col="blue", axes=FALSE, xlab="")
axis(1, at=12*60*0:2, labels=c("1:00", "2:00", "3:00"))
axis(2, at=seq(0, 1000, 200), labels=c("0","200","400","600","800",""), las=1)
abline(v=12*60*0:12, col="lightgray", lty=3)