CREATING AN R PACKAGE
8/5/22
I’ve always shared my R code as source files, but have been wanting to share it as a package. Here’s what I’ve learned.
There are many similar guides online, and although most stress using RStudio, it doesn’t seem necessary, so I will be using the R app and a text editor throughout. A few of the guides I’ve found useful are Albert’s Blog, Patricio R Estévez-Soto’s blog, Open Plant Pathology, and Fong Chun Chan’s Blog. Albert’s blog is especially good, and what follows is largely modified from it.
First steps
A few packages are needed, so install these in R, then load them.
library(available)
library(devtools)
library(roxygen2)
library(usethis)
If you intend to distribute your package through CRAN or git, check to see that your name for your package is available, using a function from the available package installed above. For this post, I’ll use ’triangle‘ for the name of my package, although that name is not available.
available("triangle")
In R, navigate to the directory where you’d like to create your package (I’ll make this on my Desktop), then use the create() function from devtools to create the shell of the package.
setwd("~/Desktop")
create("triangle")
.It will look like this:
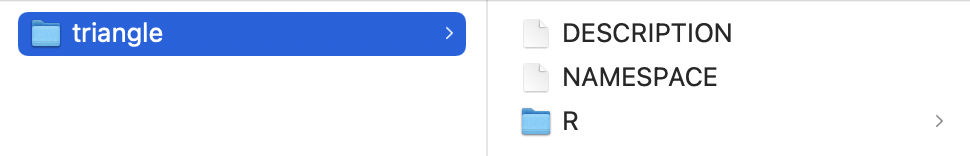
The DESCRIPTION and NAMESPACE files can be opened in your text editor. DESCRIPTION has information about you and your project. NAMESPACE is an auto-generated file for the project’s documentation; you will not edit it by hand.
Edit DESCRIPTION
The DESCRIPTION file initially has placeholder stubs for information about your project.
Package: triangle
Title: What the Package Does (One Line, Title Case)
Version: 0.0.0.9000
Authors@R:
person("First", "Last", , "first.last@example.com", role = c("aut", "cre"),
comment = c(ORCID = "YOUR-ORCID-ID"))
Description: What the package does (one paragraph).
License: `use_mit_license()`, `use_gpl3_license()` or friends to pick a
license
Encoding: UTF-8
Roxygen: list(markdown = TRUE)
RoxygenNote: 7.2.1
Edit these fields as appropriate. If you have an ORCID (if you’re not sure, you don’t), you can enter it. Here, I’ve just removed that part from the person entry. Think carefully about the license, and Coding Horror and thinkR offer suggestions. A web search will turn up plenty of advice. For version numbers, the first digit is a major version, the second digit is for minor updates that include new features, and the third digit is for bug fixes. I picked a value of 0.1.0, as this is the first pre-release version; the first public release would be 1.0.0.
After editing, my DESCRIPTION file looks like this:
Package: triangle
Title: Plot triangles
Version: 0.1.0
Authors@R:
person("Steven", "Holland", , "steven@notmyaddress.com", role = c("aut", "cre"))
Description: This package draws triangles of all sorts, shapes, and sizes. Design your favorite triangles and share them.
License: GPL-3
Encoding: UTF-8
Roxygen: list(markdown = TRUE)
RoxygenNote: 7.2.1
Add the functions
Put each function for your package in a separate .R file; separating them is necessary for the documentation process. Put all of these files in the R directory inside the package.
Add data files
It’s a good idea to include a sample data set or two if you would like users to be able to test the functions or to see the structure of the data set that is needed. To include them, do the following.
In R, open the data set and use the save() function to save an .rda (R data) file. Be sure the name of the data set in R is name you want users to see.
save(sandstone, file="sandstone.rda")
In the Finder, create a folder inside your package called data. Put the .rda file you just created inside this data folder
Create a file called sandstone.R (that is, one corresponding to the name of the .rda file) and place it in the man directory. The contents should look something like this:
#' Sandstone data set
#'
#' Example data set of point counts of sandstones from the Jurassic of Wyoming, U.S.A.
#'
#' @name sandstone
#' @docType data
#' @author Steven Holland \email{steven@notmyaddress.com}
#' @keywords data
NULL
Edit this to match your data set, with a title on the first line, a blank line, a short description, and then names that follow the tags, matching your data.
These contents will be used to make the documentation, described next.
Create the documentation
One of the great things about R is the documentation whenever you type a question mark before a function or run help() on a function. The next step is to generate that documentation. For that, we will use a tool called Roxygen (installed above), and it will work off some formatted text that will be added of the R function files. We will follow the formatting carefully to match the conventions in R. Start by pasting the following at the top of each .R file.
#' TITLE
#'
#' `FUNCTION` ONE-SENTENCE DESCRIPTION.
#'
#' LONGER DESCRIPTION
#'
#' @export
#'
#' @param ARGUMENT EXPLANATION
#' @param ARGUMENT EXPLANATION
#' @return EXPLANATION
#'
#' @examples
#' EXAMPLES
#'
Now, edit each of these as appropriate. For example, one function in my project now looks like this:
#' Create a Ternary Plot
#'
#' `ternaryPlot` creates a ternary (triangular) plot from three variables that sum to 100%, such as petrographic data in geology. It specifies the labels for the three apexes of the triangle, whether a grid should be shown, and the spacing of the grid lines.
#'
#' @param x a data.frame with three columns. The first column corresponds to the top of the triangle, the second to the bottom left, and the third to the bottom right. All values should be between 0 and 100, and each row should sum to 100.
#' @param plotPoints whether to plot points or to leave plot empty.
#' @param labels a vector of length three with strings to be plotted at the top, bottom left, and bottom right corners of the triangle.
#' @param grid whether to plot a background grid
#' @param increment spacing of grid lines, ranging from 1 to 50.
#' @param arguments to be passed to the points, such as type, color, size, etc.
#'
#' @examples
#' values <- data.frame(Q=c(20, 30, 44), F=c(10, 33, 20), L=c(70, 37, 34))
#' ternaryPlot(values, labels=c("Q", "F", "L"))
#'
ternaryPlot <- function(x, plotPoints=TRUE, labels=c("", "", ""), grid=TRUE, increment=20, ...) {
ternaryTriangle()
ternaryLabels(labels[1], labels[2], labels[3])
if (grid == TRUE) { ternaryGrid(increment) }
if (plotPoints == TRUE) { ternaryPoints(x, ...) }
}
The first line will become the title of the help page; keep this short. The second line will be the description; note that the name of the function is surrounded by backticks to make it display as code. The lines beginning with @param begin with each one of the parameters, followed by a description of what that argument does. The code following @examples gives an example of how to run the function; these should be executable, that is, the example should work as is. Notice that the sections are separated with line with only #'. Roxygen will convert this to the formatted help page.
In some cases, your code will include helper functions used by other functions but that shouldn’t be visible to the user. Exclude documentation for these by deleting the @export line; in other words, include @export if you want this to be visible to the user.
Once all of documentation has been completed for the files, create the actual documentation files. Navigate to the project directory in R if you are not there already, and run document():
document()
If all goes well, all the documentation files (.Rd) will be generated. Follow the directions if any errors arise, and do some web-searching to see how to fix them. The project direction should now look like this, with one file in man for every file in R:
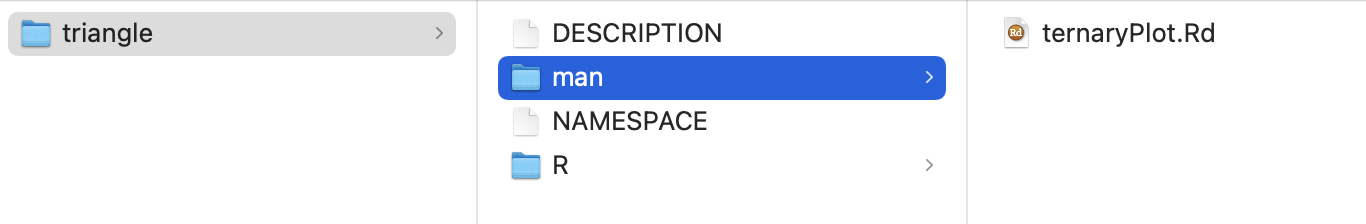
NAMESPACE has also been updated to show which functions are being exported from the package.
document() must be re-run every time changes are made to the documentation.
Install the package
While inside the project directory in R, install and load the package:
install()
library(triangle)