Sandstone provenance
31 October 2016; Updated 7 December 2018 to allow for more grain types and faster plotting.
The provenance or plate tectonic source of sandstones is commonly inferred from point counts of their constituent grains (Dickinson and Suczek 1979). I’ve created R code for making the four most common of these ternary diagram provenance plots. A single function, provenancePlot(), is used to create all of these plots.
Source code for this project is contained in sandstoneProvenance.r, and the source code for making ternary diagrams (ternary.r) is also required. See my previous post on making ternary diagrams to understand how to use those functions.
Setting up the data
The data should be set up in a data frame, with columns for the grain types, and samples in rows. The functions assume certain names for the grain types, and these must match exactly. In particular, the functions expect to see these column names (case and spelling matter): quartz, chert, plagioclase, kfeldspar, feldspar, lithic, plutonic, volcanic, metamorphic, sedimentary, and shale. Note that the ‘feldspar’ and ‘lithic’ columns are for those grains that cannot be assigned more precisely, such as a feldspar that cannot be assigned to kfeldspar or plagioclase. If you do not have a particular type of grain, you do not need to include that column in your data frame. If you have other grain types, such as if you have split out the lithic grain types even more finely, you will need to modify the data frame function (ternaryValues()) to use your variable names.
Note that the plots are smart in aggregating the data. For example, the total amount of feldspar will be calculated as the sum of the plagioclase, kfeldspar, and feldspar columns. Likewise, the lithic value will be the sum of the lithic, plutonic, volcanic, metamorphic, sedimentary, and shale columns (and sometimes chert, depending on the plot). In other words, each of your grains should be counted in only one column; for example, don't include a single grain in both the plagioclase and feldspar columns.
Last, your columns can be simply the counts of grains, or they can be converted to percentages (0–100) or proportions (0.0–1.0). The plots will work in all cases, provided you are consistent.
For this example, I will read in the data and assign it to a data frame called sandstone.
sandstone <- read.table("provenanceExample.txt", header=TRUE, row.names=1, sep=",")
Creating one provenance plot
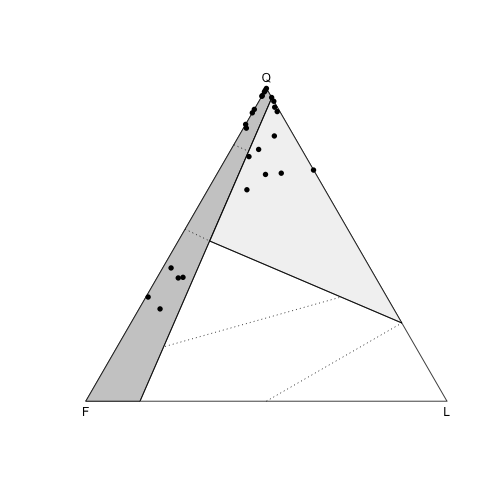
The most basic of the provenance plots is the Q-F-L plot, which puts monocrystalline and polycrystalline quartz (including chert) at the top, all feldspars at the left, and all lithics (rock fragments, but not chert) at the right. The function provenancePlot() takes two arguments, the first being the data frame, and the second being a string that indicates the type of provenance plot. To make this basic plot, specify "QFL". You can pass other arguments to specify how the points will be plotted, using the standard values you would use in any plot() or points() call, such as pch, col, etc. Here, I use small filled circles for the data points (pch=16).
provenancePlot(sandstone, "QFL", pch=16)
Three other options are available for individual provenance plots:
1) "QmFLt" plots monocrystalline quartz, all feldspars, and total lithics (including chert). It is essentially the same as a QFL plot, but with polycrystalline quartz plotted with the other lithic grains.
2) "QpLvLs" discriminates among the common types of rock fragments. It plots polycrystalline quartz, volcanic rock fragments, and sedimentary rock fragments at the three corners.
3) "QmPK" offers insights from the types of feldspars. It plots monocrystalline quartz, plagioclase, and potassium feldspar.
Creating all four provenance plots at once
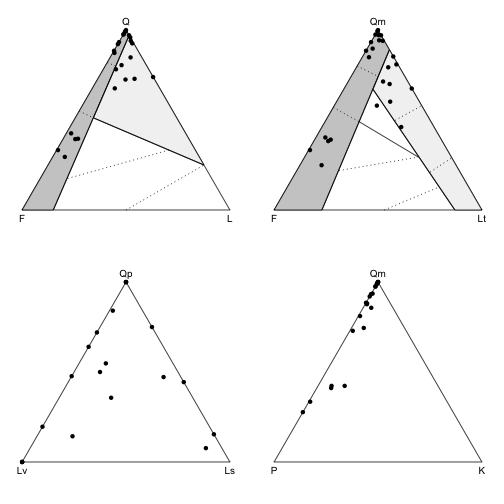
You can plot all four provenance plots at once by setting plot type to "allFour".
provenancePlot(sandstone, "allFour", pch=16)
Customizing a plot
If you want to add points with different styles to a provenance plot, for example, with different formations or sequences plotted in different colors, first use the ternaryPlot() function to make the ternary plot. Add the fields for the plot with qflFields() or one of the related functions, then finish by adding each set of points with ternary Points().
ternaryPlot(sandstone, labels=c("Q", "F", "L"), grid=FALSE, plotPoints = FALSE) qflFields() ternaryPoints(dataSet1, pch=16, col="black") ternaryPoints(dataSet2, pch=16, col="red") ternaryPoints(dataSet3, pch=16, col="blue") # etc.
References
Dickinson, W.R., and C.A. Suczek. 1979. Plate tectonics and sandstone compositions. AAPG Bulletin 63:2164—2182.
Code files
Comments
Comments or questions? Contact me at stratum@uga.edu
