Back off man. I’m a scientist.
Peter Venkman
Back off man. I’m a scientist.
Peter Venkman
PUT A LID ON IT
09/16/2012
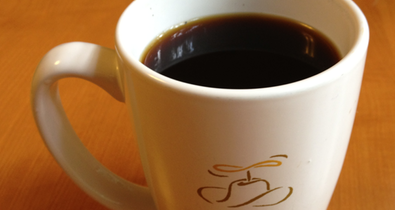
After building the Arduino temperature logger, I can get to the real question: how can I keep my coffee warmer for longer? After a good bit of experimentation, the answer was intuitive and simple: put a lid on your mug.
Of the experiments I did, three are pertinent. The first is the control, filling a mug with hot (180° F / 82° C) water and letting it cool. In the second, I pre-heated the mug, because doing this would stop at least one avenue of heat loss. In the third, I added a lid.
To preheat the mug, I placed the mug in a large pot of water, brought it all up to temperature, then fished out the filled mug with a pair of tongs. In practice, you could do this much more easily by filling the mug with water and heating it in the microwave. For this experiment, I wanted to be sure the mug and water were equilibrated, and that the water was the right starting temperature.
For the lid experiment, I cut a rectangle of half-inch-thick styrofoam, with a small hole cut in the center, just large enough for the temperature probe.
Cooling fluids should follow Newton’s Law of Cooling, that is, the rate of temperature change is proportional to the difference in temperature between the fluid and the ambient temperature. The law that describes this is:
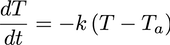
where T is temperature, t is time, Ta is the ambient temperature, and k is the rate of cooling.

Integrating this gives the temperature at any given time as a function of the ambient temperature, the starting temperature (To), the cooling rate, and time.

Taking the log of both sides puts it into a linear form. In other words, if you take the logarithm of the difference between the observed temperature and ambient temperature and plot it against time, you should see a linear relationship as the liquid cools.
Here’s the results:
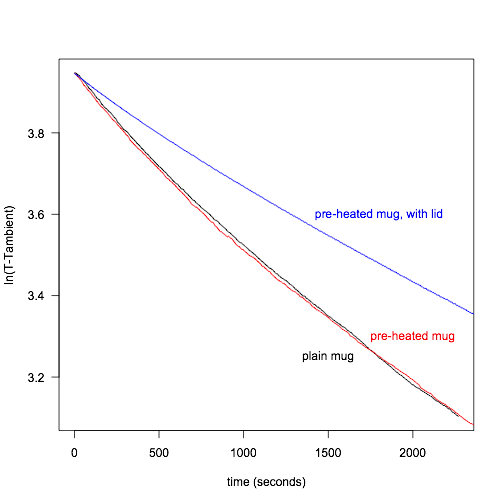
The obvious result is that putting a lid on substantially lowers the rate of cooling. For example, the first 15° C drop in temperature takes about 13 minutes for the plain mug and the preheated mug, but almost 21 minutes for the mug with the lid. If you want to keep your coffee warm, put a lid on it. (Your mom would tell you at this point that she didn’t need some fancy-shmancy science to know this.)
The surprise for me is that preheating the mug has virtually no effect: the cooling curves are nearly identical. If I replicated my results, I’m sure that the two would be within error of each other. Pre-heat your mug? Don’t bother.
Finally, what I didn’t expect is that these curves are not linear: all of them are slightly concave. I still have no good idea why this is, and I’m checking on it. One thing I have ruled out is sensor error: I’ve cross-checked my temperature probe with a mercury thermometer and the measurements are accurate.
All my data analysis was performed in R. My Arduino temperature logger saves the data in comma-delimited format, with the time, a comma, a temperature, followed by a carriage return, and if you save your data in this same format, these scripts should run as is.
Here is the R code:
# First run, just cooled the water
dat <- read.table("noPreheat.txt", header=TRUE, sep=",")
attach(dat)
time <- time - min(time)
Ta <- 22.56 # ambient temperature
Yt <- temperature - Ta
plot(time, log(Yt), type="l", xlab="time (seconds)", ylab="ln(T-Tambient)", las=1)
To <- max(temperature)
Yo <- To-Ta
reg <- lm(log(Yt)~time)
summary(reg)
# abline(reg, col="black", lty=3)
YTmax <- max(Yt) # keep this value so that the other plots are scaled to the same point
time[max(which(Yt>(YTmax-15)))]/60 # Time (in minutes) to cool the first 15° C
detach(dat)
remove(dat, reg, Ta, time, To, Yo, Yt)
# Second run, like before, but I preheated the mug
dat <- read.table("preheat.txt", header=TRUE, sep=",")
attach(dat)
time <- time - min(time)
Ta <- 22.56 # ambient temperature
Yt <- temperature - Ta
time <- time[Yt<=YTmax]
Yt <- Yt[Yt<=YTmax]
time <- time - min(time)
points(time, log(Yt), type="l", col="red")
To <- max(temperature)
Yo <- To-Ta
reg <- lm(log(Yt)~time)
summary(reg)
# abline(reg, col="red", lty=3)
time[max(which(Yt>(YTmax-15)))]/60 # Time (in minutes) to cool the first 15° C
detach(dat)
remove(dat, reg, Ta, time, To, Yo, Yt)
# Third run, but with preheated mug and top covered with styrofoam
dat <- read.table("lid20point87.txt", header=TRUE, sep=",")
attach(dat)
time <- time - min(time)
Ta <- 20.87 # ambient temperature
Yt <- temperature - Ta
time <- time[Yt<=YTmax]
Yt <- Yt[Yt<=YTmax]
time <- time - min(time)
points(time, log(Yt), type="l", col="blue")
To <- max(temperature)
Yo <- To-Ta
reg <- lm(log(Yt)~time)
summary(reg)
# abline(reg, col="blue", lty=3)
time[max(which(Yt>(YTmax-15)))]/60 # Time (in minutes) to cool the first 15° C
detach(dat)
remove(dat, reg, Ta, time, To, Yo, Yt)
text(1500, 3.25, "plain mug", col="black")
text(2000, 3.3, "pre-heated mug", col="red")
text (1800, 3.6, "pre-heated mug, with lid", col="blue")