ARDUINO AND R
2/22/2015
Like Hepburn and Bogart, Arduino and R are made for each other. The only trick is getting the two to talk. I came across a recent post on Mages’ blog with that trick. With it, I made R read temperature data from the Arduino and plot it in real time.
The trick is easy and requires only three lines of R code:
f < - file("/dev/cu.usbmodemfd121", open="r")
scan(f, n=1, quiet=TRUE)
close(f)
The first line opens a serial connection from your computer to the Arduino board. In Arduino.app, you communicate with your Arduino board through a serial port, and your current port is shown (on OS X) in the bottom right of your sketch window. On mine, it says /dev/tty.usbmodemfd121. Yours will likely have different characters following the word modem, and you will need to use those. You may have also noticed when you set a port that you can choose between tty and cu, and these are explained well on Mike’s PBX Cookbook. The tty option is for calling into a UNIX system, and cu is for calling out from one. We want to call out from our Mac to our Arduino board, so we use the cu option. We also need to specify that we are reading, so the open parameter is set to “r”.
To read one line of data, we use scan(), setting the number of lines to one. I also set quiet to TRUE, so that it doesn’ write “Read 1 line” every time R reads from the serial port.
Last, we close the port when we are done reading from it. Simple!
Let’s go over the whole project, which is similar to my previous post on an Arduino temperature logger.
You will need:
The temperature probe has three leads, one each for 5V, ground, and signal. The leads on mine are made of twisted copper, so I soldered solid 22 gauge wire to each, with red for 5V, black for ground, and green for signal. Insert them into the breadboard as shown below.
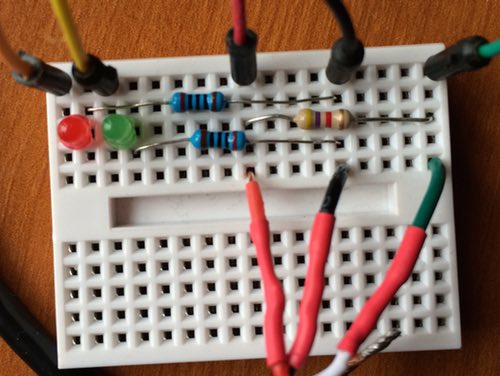
Connect the signal and 5V leads with the 470 kΩ resistor (the brown one above). Connect the ground lead to the short lead of the green LED with one of the 200 Ω resistors, and connect the ground lead to the short lead of the red LED with the other 200 Ω resistor.
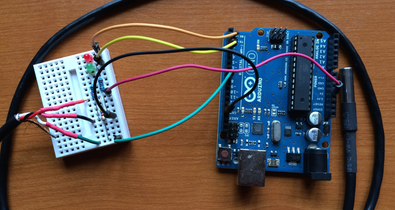
There are five connections to make to the Arduino board. Starting with the left side in the picture, and working to the right, connect the long lead of the red LED to Arduino digital pin 2 (orange wire). Connect the long lead of the green LED to Arduino digital pin 3 (yellow wire). Connect the 5V lead of the temperature probe to 5V on the Arduino (red wire), and connect the ground lead of the temperature probe to GND on the Arduino (black wire). Last, connect the signal lead of the temperature probe to Arduino digital pin 8 (green wire).
The Arduino sketch is a simplified version of my Arduino temperature logger, which explains the code. The variable pauseBetweenReadings sets how frequently a temperature reading is taken.
Compile and run this Arduino code, and open the serial monitor to verify that temperature data is being transmitted. Quit Arduino when you are done, because R must be the only app trying to use the serial port for the Arduino board. If the Arduino app is also running, you will get an error in R about the port already being in use.
The R code starts with some setup to specify the total time that recording should continue and the time interval between readings. Both are in seconds, and both are approximate. I’ve found that the actual time between readings is about 0.01–0.08 seconds longer than what I specify, presumably because the other code takes some time to run. We also specify the minimum and maximum expected temperature to set the y limits of the plot. Last we open the connection to the Arduino.
totalTime <- 60
interval <- 1
minExpectedTemp <- 10
maxExpectedTemp <- 30
f <- file("/dev/cu.usbmodemfd121", open="r")
Next, we calculate the number of observations to be made, and create vectors to hold the time and temperature readings.
observations <- totalTime/interval
temperature <- rep(NA, observations)
time <- rep(NA, observations)
Get the starting time for the run, so that the elapsed time can be measured. Also, read the first value from the Arduino board. Sometimes, this first reading comes in odd, so I read it but don’t plot it.
startTime <- Sys.time()
scan(f, n=1, quiet=TRUE)
Make the frame for the plot, rotating the y-axis labels (las=1), specifying that no points are initially shown (type="n"), setting the limits of the x and y axes, and setting the labels for the x and y axes.
plot(time, temperature, las=1, type="n", xlim=c(0, totalTime), ylim=c(minExpectedTemp, maxExpectedTemp), xlab="time (seconds)", ylab="temperature (°C)")
Next is the loop that does the main work. It steps through each of our observations, getting a value from Arduino with scan() and storing it in the temperature vector. Elapsed time is calculated with difftime() and Sys.time(), using our stored value of the starting time as the reference point. All of the points are plotted with points(); this is set up to plot small filled circles (pch=16, cex=0.8), connected by lines (type="o"). This is the line to change if you want to change how the data are shown. Last, pause execution to set how frequently a reading is obtained.
for (i in 1:observations) {
temperature[i] <- scan(f, n=1, quiet=TRUE)
time[i] <- difftime(Sys.time(), startTime, units=c(’secs'))
points(time, temperature, pch=16, cex=0.8, type="o", col="blue")
Sys.sleep(interval)
}
Last, close the serial port when finished.
close(f)
That’s it!
#include ⟨OneWire.h⟩
// Connections
// black lead from temperature sensor to ground
// red lead from temperature sensor to 5V
int temperatureProbePin = 8; // green lead from temperature sensor
int greenLEDPin = 3;
int redLEDPin = 2;
// Timing, in milliseconds
int pauseBetweenReadings = 1000;
int timeForLitLED = 100;
uint32_t startTime;
// Other
int probeErrorCode = -1000;
OneWire ds(temperatureProbePin);
void setup() {
pinMode(greenLEDPin, OUTPUT);
pinMode(redLEDPin, OUTPUT);
startTime = millis();
Serial.begin(9600);
}
void loop() {
uint32_t timeNow = (millis() - startTime)/1000;
float temperature = getTemp();
if (temperature != probeErrorCode) {
Serial.println(temperature);
digitalWrite(greenLEDPin, HIGH);
} else {
digitalWrite(redLEDPin, HIGH);
}
delay(timeForLitLED);
digitalWrite(redLEDPin, LOW);
digitalWrite(greenLEDPin, LOW);
delay(pauseBetweenReadings-timeForLitLED);
}
float getTemp() {
byte data[12];
byte addr[8];
if ( !ds.search(addr)) {
//no more sensors on chain, reset search
ds.reset_search();
return -1000;
}
if ( OneWire::crc8( addr, 7) != addr[7]) {
Serial.print("CRC is not valid!\n");
return -1000;
}
if ( addr[0] != 0x10 && addr[0] != 0x28) {
Serial.print("Device is not recognized\n");
return -1000;
}
ds.reset();
ds.select(addr);
ds.write(0x44,1);
byte present = ds.reset();
ds.select(addr);
ds.write(0xBE);
for (int i = 0; i < 9; i++) {
data[i] = ds.read();
}
ds.reset_search();
int LowByte = data[0];
int HighByte = data[1];
float TRead = (HighByte << 8) + LowByte;
float Temperature = TRead / 16;
return Temperature;
}